 How-to
How Do You Evaluate Rental Property Appreciation?
Quick Summary
To evaluate rental property appreciation, start with closed sales of comparable homes nearby over the last 12 to 24 months. Then compute a compound annual growth rate from median prices, cross-check it against neighborhood supply and demand, and test conservative, base, and optimistic scenarios. Appreciation should be judged alongside cash flow and paydown, not alone.
- Pull closed sales of similar homes within a short distance, using the last 12 to 24 months.
- Calculate CAGR from median sale prices over a 10- to 15-year window that includes a downturn.
- Subtract inflation to approximate real growth, then subtract selling costs and taxes from projected sale price.
- Model conservative, base, and optimistic cases, and confirm the deal works if values stay flat.
- Compare appreciation with cash flow and paydown, since total return matters more than projected sale price.
Table of Contents
- Why Appreciation Matters Less Than You Think on Its Own
- Step 1: Pull Local Sales Data and Comparable Sales
- Step 2: Read Neighborhood Trends, Supply, and Tenant Demand
- Step 3: Build a Repeatable Forecast and Adjust for Inflation
- Step 4: Test Scenarios and Account for Risks That Limit Value
- How to Calculate Rate of Return on Rental Property
- What Is a Good ROI for Rental Property?
- Deciding Whether a Property Is Worth Buying Next
- Frequently Asked Questions
Why Appreciation Matters Less Than You Think on Its Own
Most landlords hear that property values rise over time and assume a rental will build wealth on its own.
Appreciation is the increase in a property's market value over time.
Watch out: Do not judge a property by its expected sale price alone.
Use this guide to test appreciation potential with evidence. The steps below cover local sales, neighborhood trends, forecasting, and risk.
Step 1: Pull Local Sales Data and Comparable Sales
Start with what similar homes have actually sold for nearby. Comparable sales, often called comps, show what buyers pay in your target area. Look at homes of similar size, age, and condition within a short distance.
Pull sales from the last 12 to 24 months. Note the sale price, date, and square footage for each one.
- Use only closed sales, not listings still on the market
- Match property type, such as single-family or townhome
- Track whether values rose, fell, or stayed flat over time
Repeat this step every year. Your first snapshot is a starting point, not a forecast.
Step 2: Read Neighborhood Trends, Supply, and Tenant Demand
Values depend on what is happening around the property. A tight supply of homes often supports prices, while a glut of new listings can slow growth.
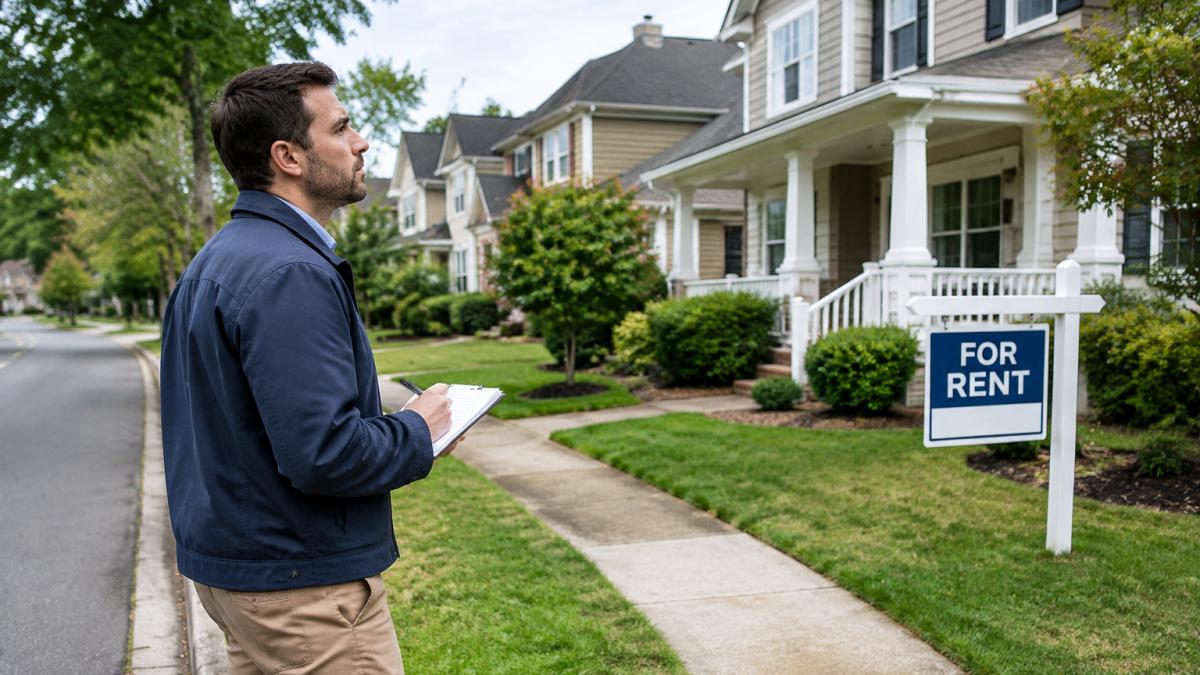
Check rental demand too. Vacancy rates, new job openings, and nearby schools all affect how many tenants want to rent there. Strong demand supports both rent and value.
A common mistake is relying on citywide numbers. Neighborhood trends can differ sharply from one block to the next, so focus on the specific area around your property when judging rental property appreciation. Explore Portsmouth's waterfront and historic neighborhoods to see the local appeal behind those trends.
Step 3: Build a Repeatable Forecast and Adjust for Inflation
A forecast turns your research into a number you can test. The goal is not to predict the future precisely; it is to make your appreciation assumption transparent, sourced, and repeatable so you can compare properties on the same basis.
Derive a local rate from evidence, not a generic assumption
Start with the average annual appreciation from your comparable sales in Step 1. A practical approach is to compute the compound annual growth rate (CAGR) of median sale prices for the same property type in the same neighborhood over a 10- to 15-year window that includes at least one downturn. The formula is:
- CAGR = (Ending value ÷ Beginning value) ^ (1 ÷ number of years) − 1
Use median prices rather than averages to reduce distortion from a few unusually large or small sales. If your comps only cover 12 to 24 months, supplement them with public county recorder price histories, local multiple listing service (MLS) trend reports, and the Federal Housing Finance Agency (FHFA) House Price Index, which publishes repeat-sales price indexes by state and metropolitan area.
Cross-check your derived rate against supply and demand signals from Step 2. A neighborhood with rising permits for new construction, flat or declining household counts, and lengthening days-on-market is unlikely to sustain above-average appreciation, regardless of what the last few years show.
Apply the rate over your holding period
Apply the rate to the purchase price over your expected holding period using compound growth:
- Forecast value = Purchase price × (1 + annual rate) ^ years
Run the calculation for the full period you expect to own the property, not just the first year. A 3% rate compounds to roughly 34% over 10 years, while a 5% rate compounds to roughly 63%, small differences in the assumed rate produce large differences in projected equity, which is why the assumption must be sourced rather than borrowed from a podcast.
Separate nominal appreciation from real, after-cost growth
A 4% annual gain sounds strong, but if inflation runs near the same level, the real gain is much smaller. Subtract the inflation rate from the nominal appreciation rate to approximate real growth, or divide (1 + nominal rate) by (1 + inflation rate) and subtract 1 for a more precise figure.
Then subtract the costs of turning paper gains into cash. Selling a property typically involves real estate commissions, title and escrow fees, transfer taxes where applicable, and seller concessions. Selling costs vary by state and negotiation, so use your own local figures in the calculation. Your net proceeds are:
- Net proceeds = Forecast sale price − Mortgage payoff − Selling costs − Capital gains taxes owed
Depreciation recapture and capital gains treatment can materially change what you keep, so confirm your situation with a tax professional before treating a projected sale price as profit.
Keep the method consistent
Use the same data window, the same CAGR formula, and the same inflation and selling-cost assumptions every time you evaluate a property. Consistency makes it easier to compare options fairly and to spot when a seller's pro forma is relying on an appreciation rate your own evidence does not support.
Watch out: Do not anchor on the last two years of price growth in a hot neighborhood and extrapolate it across a 10-year hold; that pattern has repeatedly produced forecasts that collapsed when supply caught up or rates moved. Because a hot neighborhood’s recent gains can obscure how supply and borrowing costs shape a longer hold, The Mills Team’s perspective on Charleston real estate can be weighed against those same fundamentals.
Step 4: Test Scenarios and Account for Risks That Limit Value
No forecast is certain, and a single-point estimate hides that uncertainty. Build a small scenario model so you can see how the property performs if appreciation disappoints. The goal is not to predict which scenario happens; it is to confirm the deal still works if the optimistic case does not.
Build conservative, base, and optimistic cases
Use the same forecast method from Step 3 and vary only the appreciation rate:
- Conservative case: the lower end of your comp-derived range, or 0% to 1% annual growth for several years
- Base case: your blended CAGR from Step 3
- Optimistic case: the upper end of your range, capped at a rate your supply and demand evidence can support
For each case, calculate the forecast sale price, net proceeds after selling costs and mortgage payoff, and total return including cash flow and principal paydown over the hold. A property that only clears your return threshold in the optimistic case is a speculation, not an investment.
Run a sensitivity check on the variables that matter most
Appreciation is rarely the only variable that moves. Test how the deal performs if two or three inputs move together: a slower appreciation rate plus a higher vacancy rate, or a flat price plus a rise in insurance premiums. A simple sensitivity table, rows for appreciation rates, columns for vacancy or expense growth, shows quickly which inputs the deal can absorb and which ones break it.
Stress-test a flat or declining market
Explicitly model a downside case where values stay flat for three to five years, or decline modestly. Ask three questions: Can rent cover the mortgage and operating expenses if the property is vacant for two months? Can you hold through a downturn without selling at a loss? What happens to your return if you must sell during the flat period and pay full transaction costs? If the answer to any of these depends on price growth arriving on schedule, the deal carries more risk than the base case suggests.
Identify risks that can cap or reduce future value
Broad market averages miss neighborhood-level risks. Work through this checklist for the specific property and block:
- Climate and insurance exposure: flood, wildfire, wind, and hail risk can raise insurance premiums sharply or make coverage harder to obtain. Check official flood maps and state insurance department rate filings, and confirm the property is insurable at a cost your rent can support.
- Zoning and land-use changes: upzoning can add supply and compete with your unit; downzoning or new rental restrictions can limit how you use the property. Review the local planning department's agenda and future land-use map.
- New construction and permit activity: a cluster of new apartment or single-family permits nearby can absorb demand and slow rent growth. Local building permit data is usually public.
Compare appreciation with the rest of the return
Appreciation is one of four sources of return, alongside cash flow, principal paydown, and tax effects such as depreciation. A property with modest appreciation but strong cash flow and steady paydown can outperform one with a higher projected growth rate and negative cash flow, especially after selling costs and taxes. Compare each scenario on total return, not on projected sale price alone.
Watch out: Do not assume a single good year will continue, and do not treat a rising list price in a hot market as evidence of durable appreciation; test what happens if values stay flat for several years and confirm the deal still works.
The article compares scenarios and risks that can limit a property's value, which can be summarised as follows.
| Scenario | Appreciation assumption | What to check |
|---|---|---|
| Conservative | 0% to 1% annual growth | Deal still works if values stay flat |
| Base | Blended CAGR from Step 3 | Total return including cash flow and paydown |
| Optimistic | Upper end, capped by evidence | Speculation if only this case clears return |
| Flat or declining market | Flat for 3 to 5 years | Rent covers mortgage after two months vacant |
How to Calculate Rate of Return on Rental Property
Rate of return shows how much you earn relative to what you invested. To calculate it, divide your annual net income by your total cash invested, then multiply by 100 for a percentage. Walk through the full profitability calculations for your rental before you rely on appreciation.
Net income is rental income minus operating expenses such as taxes, insurance, maintenance, and vacancy. Cash invested includes your down payment and closing costs. Appreciation is separate, so add it only when you want a total return view.
- Annual net income = Rent collected minus expenses
- Cash invested = Down payment plus closing costs
- Rate of return = (Annual net income ÷ Cash invested) × 100
Running this calculation before you rely on appreciation shows whether the rental pays its way.
What Is a Good ROI for Rental Property?
A good return depends on your goals, local market, and how much risk you accept. Investors often compare the return to what they could earn in lower-risk options.
Look at return on investment over the full holding period, not one year alone.
Many landlords find that a return they can explain and defend is more useful than chasing the highest number.
Deciding Whether a Property Is Worth Buying Next
Bring every step together before you make an offer. Check that comparable sales support the price, neighborhood trends look stable, and your forecast holds under conservative assumptions. Get local tips on analyzing neighborhoods and property age in Portsmouth before committing.
If appreciation carries most of the case, slow down. Strong properties usually work on both income and value. When you are unsure, a property manager familiar with the area can help you check rent levels, tenant demand, and upkeep costs.
Frequently Asked Questions
What is a good ROI for a rental property?
There is no single benchmark, because a good return depends on your financing, holding period, local market and how much risk you accept. Many investors compare a property's annual return against what they could earn from lower-risk options and then decide whether the extra risk is justified. Calculate your return on the cash you actually invested, including down payment and closing costs, and compare it to the same figure for other properties you are considering. Treat appreciation as one part of the total return, not a guarantee.
How do you calculate the appreciation of a rental property?
Appreciation is the change in the property's market value between two points in time, expressed as a percentage of the earlier value. Start with a reliable estimate of value today and a reliable estimate from a prior date, using comparable sales for the same type of home in the same area. Subtract the earlier value from the current value, then divide by the earlier value. Adjust for improvements you made, since those add value that is not market appreciation.
How do you calculate rate of return on rental property?
Divide your annual net return by the total cash you invested, then multiply by 100 to get a percentage. Annual net return is rental income minus operating expenses, vacancy losses and debt payments on interest, plus any appreciation you expect to realize. Include your down payment, closing costs and initial repairs in the cash invested. Compare the figure across properties using the same assumptions so the comparison is fair.
What factors influence rental property appreciation?
Appreciation is driven mainly by location, local job growth, housing supply, neighborhood improvements, property condition and the age of the home. Areas with limited new construction and steady demand from renters and buyers tend to see stronger value growth, but this is not guaranteed. Look at local sales history over several years rather than one good year, and check whether the trend is supported by employment and population data.